Technical Support
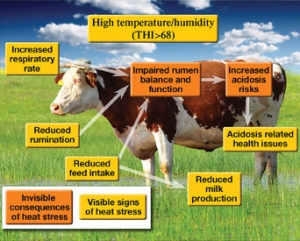
- When the THI exceeds 72, cows are likely to begin experiencing heat stress and their incalf rates will be affected.
- When the THI exceeds 78, cows milk production is seriously affected.
- When the THI rises above 82, very significant losses in milk production are likely, cows show signs of severe stress and may ultimately die.
A number of important points should be made about the THI:
- A THI of 72 may under-estimate heat load in high-yielding Holstein-Friesian cows – increasing milk yield increases cows’ sensitivity to heat stress.
- Recent research shows that increasing milk production from 35 to 45 litres/day reduces the threshold temperature for heat stress by 5°C.
- THI does not account for solar radiation or air movement – those two factors, along with air temperature and relative humidity, determine the heat gained and lost between the cow and the environment.
- THI does not enable you to measure the accumulation of heat load over time, e.g. after several days. Despite these limitations, THI is still a useful and easy way to assess and predict the risk of heat stress; however, it is wise to be conservative. If you have a herd of high-producing Holstein-Friesian, it is better to overestimate the risks of heat stress using a lower THI than get caught out.
|
THI is calculated from air temperature and relative humidity using the following equation: |

As you can see in this chart, a THI of 78 occurs at:
- 31ºC and 40 % relative humidity; or
- 27ºC and 80% relative humidity
|
|
Consider this chart, which shows the average and expected range of daily THI values for a particular location, against a background of relative THI bands based on historical weather data.
- You can see that for this location, conditions likely to result in periods of moderate heat stress occur commonly from November to March. However, periods of high heat stress do also occur, most often in January/early February. As early as mid-October and as late as March-April, herd milk production and in-calf rates may still be affected if heat load is not actively managed.
- At this location, the appropriate time to go on alert is mid-October
An example of an annual THI probability graph


